During a random sketch-up session of our dream family home — the kind where the architectural ideas would give any civil engineer a headache — we hit a roadblock, not because of the floating staircases or very random takedowns of probably important walls, but because an electrical engineer was present, and wouldn't allow a random design of a PV solar system.
How do we go completely off-grid — properly?
It wasn't the first time this question had come up. In most rural parts of Zimbabwe, the default "design method" is simple: buy the biggest solar system you can afford and hope for the best. Honestly, that approach isn't all that bad — economics usually forces people to stay far away from actual overdesign. But it's still reactive and doesn't guarantee you'll have adequate power.
And I had proof of that — my grandmother's existing off-grid solar system.
Despite being a good first step, her current setup couldn't keep up with actual usage. Random blackouts, undercharged batteries, appliances that had to be switched off "just in case" — "Tikasadzima handizokwanise kuona TV".
So I figured: why not do it properly?
As an electrical engineer with a fresh course in PV system design, I decided to design a real, well-sized solar setup for her home in Gutu, Zimbabwe. And while I was at it, I thought I'd turn the process into a blog post — partly to explain the concepts to friends and family who keep asking, and partly because I had to teach myself a few things along the way.
What follows is a walkthrough of that process — from site layout and orientation issues to panel sizing, tilt angles, and how to account for a roof slightly off from true north. All are based on a real home, with real constraints, and hopefully some real-world insights.
1. Site Inspection
I had exactly one option for placing the solar panels: the roof.
Sure, my grandmother has a good amount of land around the house — classic rural Zimbabwe spacing — but if you know anything about Mbuya Fanny, it's this: she would sooner sleep in the dark than sacrifice a single square meter of perfectly farmable land to a solar array.
And honestly? She has a point. Ground-mounted panels aren't always the answer, especially when the roof space is usable — which, in this case, it is (more on that later).
Before committing to the design, though, there were a few environmental factors to consider:
Shade Analysis: Fortunately, there are no tall trees, water tanks, or weirdly ambitious neighbor constructions near the homestead. So we can assume minimal shading — a dream scenario in PV design terms.
Sun Hours: According to available solar irradiance data for the Gutu region, the area averages around 5.08 Sun hours a day. This value is crucial for estimating how much energy a system can reliably generate.
Sun hour calculation:
To improve performance, solar panels shouldn't lie flat. Instead, you tilt them to better align with the sun's position throughout the year. In this case, we used a tilt angle of 23°, close to the latitude a good compromise for year-round performance. But a standard 30 is used.
To fine-tune our sun hour estimate with tilt factored in, you can use formulas that adjust for declination angle (the sun's position relative to the Earth's equator) and elevation angle (how high the sun gets in the sky).
Declination Angle
The declination angle (δ) varies by day of the year and is calculated using:
Where n is the day of the year (1 for Jan 1, 365 for Dec 31).
Elevation Angle
The solar elevation angle at solar noon is approximated as:
This tells you how high the sun is in the sky — important for knowing how much direct light your panels get.
Peak Sun Hours with Tilt
To estimate peak sun hours adjusted for tilt, you can use this simplified approach:
In our case, using Latitude = 20° and Tilt = 23°, this becomes:
So we can multiply each month's horizontal insolation by ~1.06 to get a more realistic estimate for a fixed 23° tilted system.
This gives us a pretty solid average of about 6.0 peak sun hours per day, year-round — excellent conditions for solar generation. However since the maximum and the minimum difference is greater than 2 hours, to ensure that there are no blackouts on those minimum days the minimum is used for the design.
While declination and elevation angles aren't strictly needed in every residential design — especially when using fixed-tilt panels — they're important for understanding the seasonal movement of the sun, shading behavior, and informing more advanced or optimized designs. I calculated them to get a clearer mental picture of how the sun behaves over my grandmother's house in June vs. December, even if the final system doesn't rely on them directly.
The north-facing roof of my grandmother's house in Gutu, Zimbabwe, is 10° off from true north. While that's not perfectly aligned, it only reduces the system's efficiency by about 1.5%, which is negligible in most home setups.
With a roof area of 74 m² and assuming modern 400W panels, I can fit about 43 panels — totaling 17.2 kWp. For rural electrification or a hybrid grid/off-grid system, that's more than enough power to support household appliances, lighting, irrigation, and even a small fridge or freezer.
2. Energy Audit
We need to figure out how much energy the house consumes on average. For a solar system to work reliably, it must be based on real usage. So, we estimate how much electricity each device or appliance uses, for how long, and how often. The table for that is shown below.
Energy Audit Report
| Loads | Notes | Power (Watts) | Quantity | Duration (H) | Total Power (Watts) | Energy (Watt.H) |
|---|---|---|---|---|---|---|
| Outside Lighting | Night use | 15 | 3 | 8 | 45 | 360 |
| Room Lighting | Night use | 5 | 8 | 8 | 40 | 320 |
| TV (LED 55") | Family room centerpiece | 80 | 1 | 6 | 80 | 480 |
| Refrigerator | Runs all day, but cycles on/off (~50% duty) | 150 | 1 | 12 | 150 | 1800 |
| Decoder | Used with TV | 7 | 1 | 6 | 7 | 42 |
| Phones Charging | 4 phones using 20W charging | 12 | 4 | 2 | 48 | 96 |
| Miscellaneous | Other small devices not included | 5 | 1 | 0.5 | 5 | 2.5 |
| TOTALS | 525 W | 4.9 KW.Hr | ||||
3. Solar Array Sizing
To size the PV system, we use the following:
E_daily = 5 kWh/day (Rounded Up to the nearest kWh)
System Efficiency Assumption:
Let's assume system losses of ~20%, so efficiency = 0.8
Peak Sun Hours (PSH):
Based on solar data = 5.08 hours/day
Required PV Size:
So, you'd need roughly a 1.3 kW solar system.
Number of Panels:
Assuming you're using 250 W panels:
Area Required:
Each 250W panel typically takes up ~1.6 m², so:
4. Inverter and Charge Controller Design
Now that we have our solar array sized, the next step is to make sure all that sunshine can actually power the house and charge the batteries efficiently. This is where the inverter and charge controller come in.
Inverter Sizing
The inverter converts the DC power from the panels (and batteries) into AC power that can be used in the home.
Inverter Power Requirement:
We design the inverter based on the maximum load power the house could draw — in this case, we estimated a total load of:
We also account for a power factor of 0.9, which accounts for the inefficiencies in real-world AC loads.
Must support a DC input of 36V to match our system bus voltage
Preferably includes built-in protections (overload, short circuit, low battery)
Charge Controller Sizing
The charge controller sits between the solar panels and the battery bank, managing how the batteries are charged to ensure longevity and safety.
Minimum Charge Controller Current Rating:
We use the maximum current that will go to the batteries to size the controller, and the bus voltage:
Add a safety margin of ~25%:
Rating: ≥ 45 A, for 36V system
Preferably MPPT type (I'll explain why below)
PWM vs MPPT Charge Controllers
| Feature | PWM | MPPT |
|---|---|---|
| Cost | Cheaper | More expensive |
| Efficiency | ~70–80% | ~95–98% |
| Working Principle | Drops panel voltage to match battery voltage | Converts excess voltage into additional current |
| Best For | Small systems, low budget | Larger systems, max efficiency |
Why MPPT is Better Here:
In this system, panel voltage is likely higher than battery voltage (especially in colder mornings). An MPPT controller harvests that voltage headroom, converting it into more current — meaning faster charging and less wasted energy.
Plus, with a relatively modest number of panels and variable solar conditions in Gutu, an MPPT controller ensures that even during cloudy periods or morning/afternoon tilt inefficiencies, you get the best possible energy yield.
5.Battery Design
Total Amp-Hours Needed
To design for the total battery capacity needed we need to take into account the total energy demand (from the audit) and the Days of autonomy (these are the days we will allow for the batteries to supply load without recharging), and the depth of dicharge which affects the battery life.
Battery Configuration
Each 12 V, 200 Ah battery will be arranged to match the 32 V system bus.
Series: 32/12 ≈ 2.66 ⇒ 3 batteries in series = 36V nominal
Each string gives 200 Ah
Parallel Strings: 514/200 ≈ 2.12 ⇒ 2 parallel strings for safety margin
Updated Final Configuration:
- 3 in series (36 V)
- 2 strings in parallel (600 Ah total)
- Total batteries = 3 × 2 = 6 batteries
6. Cable Sizing
You can have the best panels, the fanciest inverter, and a battery bank that looks like it could power a Mars mission — but if your cables aren't up to the task, you're just cooking copper. Here's how we make sure the system stays safe and efficient.
Step 1: Determine the Maximum Current
We size cables based on the maximum current they'll carry — and in a 32 V DC system, current can get high quickly.
Let's base our calculations on the inverter input side, which is usually where current is highest.
Current = Power / Voltage = 1300 W / 32 V ≈ 40.6 A
We add a 25% safety margin:
So we're designing for a maximum current of 51 A.
Step 2: Choose the Cable Size
To minimize voltage drop and overheating, we use standard tables (or experience) to select an appropriate size:
For 12–48 V DC systems carrying ~50 A over short distances (less than 10 m):
- 16 mm² copper cable is a safe choice.
- It gives <3% voltage drop and stays cool under load.
- Rated for ~70 A (depending on insulation and temperature).
If your run is longer than 10 meters, consider bumping up to 25 mm² just to stay on the safe side.
Step 3: Voltage Drop Check (Optional)
You can double-check the drop using:
Where:
- L = one-way cable length (in meters)
- I = current in Amps
- ρ = resistivity of copper (0.0175 Ω·mm²/m)
- A = cable cross-sectional area in mm²
Try to keep the voltage drop under 3% for DC systems.
Summary of Cable Sizing
| Application | Current (A) | Suggested Cable Size |
|---|---|---|
| Inverter DC Input | ~51 A | 16 mm² copper |
| PV Array to Charge Controller | Depends on panel config (likely less) | 6–10 mm² |
| Charge Controller to Battery | Similar to inverter input | 16 mm² |
Use DC-rated breakers and fuses for protection and always terminate connections properly to avoid heat buildup.
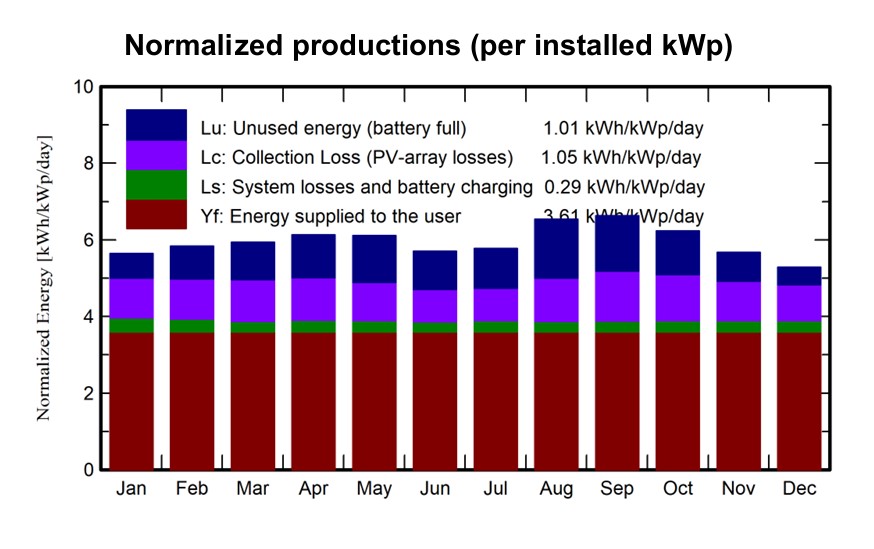
PVSYST Simulation
The PVsyst simulation confirms the manual design’s assumptions, proving that a 1.35 kW solar array and 6-battery bank can reliably power the home year-round. The system meets 100% of the load with no missing energy, while maintaining healthy battery operation and generating slightly more than needed — ensuring resilience even during less sunny periods. Minor excess energy during peak months confirms the array has headroom, which can be valuable in future upgrades or load increases.
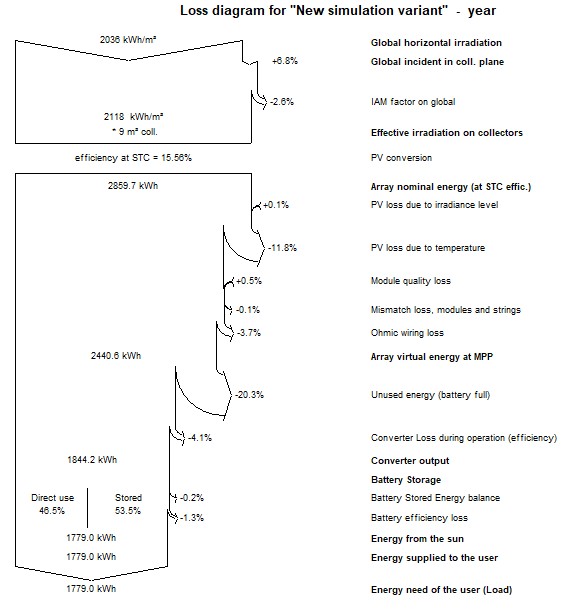
- 20.3% unused energy (battery full)
- 11.8% temperature losses
- 3.7% wiring losses
- 0% loss of load
Extra production in some months is stored or lost when batteries are full.
Increasing battery storage could reduce unused energy further.
- Performance Ratio: 60.6%
- Specific Yield: 1318 kWh/kWp/year
- Available solar energy: 2.34 MWh/year
- Energy supplied to user: 1.78 MWh/year
- Excess (unused): 495 kWh/year (~20%)
This provides margin for cloudy days, battery aging, and future load growth.
Solar System Components & Cost Breakdown
| Component | Specs / Description | Qty | Unit Cost (USD) | Total (USD) | Notes |
|---|---|---|---|---|---|
| Solar Panels | 250 W, mono/poly crystalline | 5 | $100 | $500 | Total panel power: 1250 W |
| Charge Controller (MPPT) | 40 A, 150 V MPPT | 1 | $150 | $150 | MPPT improves efficiency over PWM |
| Battery | 12 V, 200 Ah, deep cycle AGM/Gel | 6 | $180 | $1,080 | 2S3P config, ~4.9 kWh usable energy |
| Inverter | Pure sine wave, 32 V input, 1300 W output | 1 | $250 | $250 | Designed for 583 W load + safety factor |
| Mounting Structure | Roof/ground mount for 5 panels | 1 set | $150 | $150 | Includes rails, clamps, and fasteners |
| Cabling | DC-rated cables (16 mm² + 6 mm²), 25 m total | 1 lot | $100 | $100 | For panel-to-CC and CC-to-battery/inverter runs |
| Breakers & Fuses | DC breakers, inline fuses, disconnects | 1 set | $50 | $50 | For protection and safety compliance |
| Battery Enclosure | Ventilated, lockable | 1 | $80 | $80 | Optional, for safety and aesthetic appeal |
| Miscellaneous | Lugs, ties, conduit, grounding rods | 1 lot | $40 | $40 | Always forget these until you're on the roof |
| SUBTOTAL | $2,400 | ||||
| TOTAL SYSTEM COST | $2,400 | Complete Off-Grid Solar System | |||
Optimization
The 6-battery setup can be optimized in a few ways. One option is to use 3 higher-capacity batteries (e.g., 12V 300Ah), which would meet the energy demand with fewer units, though these can be bulky and harder to source affordably. Alternatively, you could deep cycle 3 × 12V 200Ah batteries, pushing them to around 75–80% depth of discharge — this would meet the energy need, but at the cost of reduced lifespan and reliability, making it a short-term solution. A smarter long-term alternative is switching to LiFePO₄ batteries, which safely allow deeper discharges and last significantly longer. While the upfront cost is higher, the total cost of ownership is lower over time, making it the most future-proof and maintenance-friendly option if budget allows.
The current design assumes that the solar panels are mounted flat on the roof, which has a pitch of 22°. However, to optimize solar irradiance, especially during the winter months when the sun is lower in the sky, increasing the tilt angle to 30° is recommended. This adjustment improves the system's performance but requires additional spacing between panel rows to avoid self-shading. Based on a panel length of 1.6 m and a winter solar elevation angle of approximately 46.5°, the minimum spacing needed is calculated using shading geometry:
This means each row must be spaced at least 0.77 meters behind the one in front to prevent shading during low-sun periods. While this slightly increases the total area required, it ensures maximum efficiency year-round by reducing power loss from shading—especially important in compact or budget-constrained systems where every watt matters.