Just Above Zero
I don't know soccer. But I know data. When I opened the Zindi World Cup dataset, my first reaction was pure confusion. What does each row mean? Which columns matter? And most importantly – how do I turn this into a submission that doesn't get a negative score?
This is the raw story of my 24-hour sprint: the mistakes, the breakthroughs, and the moment I climbed to position 56 on the leaderboard. Built on a simple philosophy: start stupid, then iterate.
Full notebook: All code, experiments, and messy plots are in the Colab below.
Open the Colab NotebookThe Data Dilemma
My first instinct was to drop everything older than 10 years. After all, those players aren't playing anymore, right? But then I realized that World Cup squads have long careers, and historical performance carries real signal. Plus, factors like population and economic development aren't directly in the dataset, but they're embedded in the historical results.
I wanted to give more weight to recent tournaments while still using the full history. That tension between recency and tradition became the core of my feature engineering.
matches_df['tournament_id'].unique().tolist()
This was my first "notable command" after a long pause. I had forgotten half the pandas syntax.
Baseline: Keep It Simple
Before any feature engineering, I built a dead-simple baseline with just a few aggregate stats per team:
- Number of World Cups qualified for
- Number of wins
- Total goals scored
- How often they reached knockouts
This gave me a benchmark. If my fancy model couldn't beat this, I knew I was overcomplicating things.
Crisis: How Does This Even Work?
I hit a wall asking myself: should I modify the train set directly? Create a separate feature table? Merge everything? After staring at the screen for 20 minutes, I realized my job was to add features to the training data, not build a separate dataset from scratch.
Once that clicked, I could move forward. But then came the real pain.
Submission Hell
Getting a valid submission took hours. Negative scores, class mismatch errors, mapping failures. With only 10 submissions per day, I was burning them fast.
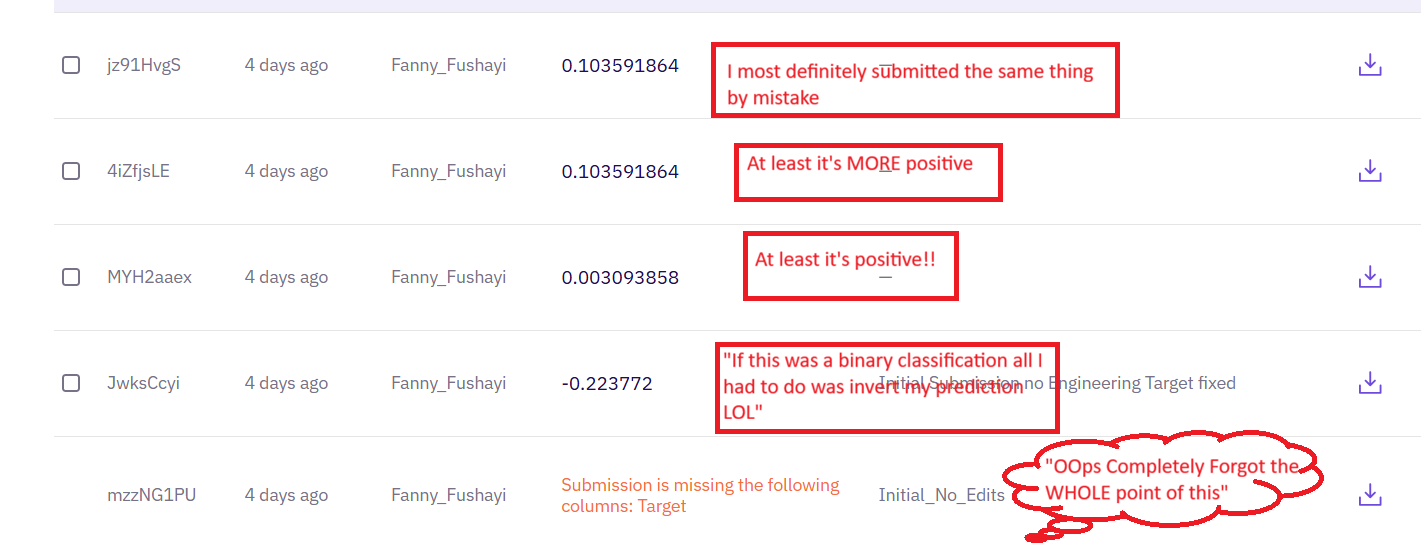
The painful first few attempts – all negative scores and mapping errors
What went wrong:
- Raw train data – I never merged my feature table, so the model trained on almost nothing.
- Stage mapping mismatch – The classifier learned 'group' and 'roundof16', but I was mapping from 'group stage' and 'round of 16'. They never matched.
- Test ID parsing – IDs like ROW_AEED1A747B28 aren't structured as tournamentid_teamcode. My parsing was garbage.
- No data inspection – I never looked at what I was actually training on. No head(), no info(), no value_counts().
After fixing these, my model finally started learning something real.
The Breakthrough: Weighted Recent Performance
I realized I had enough information to predict when a team would be knocked out, but not enough to guess exact scores. So I doubled down on stage prediction and used goals as a secondary target.
Feature 1: World Cup Qualification Count
This separates regulars from newcomers. Regular participants are more likely to escape the group stage.
Feature 2: All-Time Match Stats
Wins, goals, win rates – aggregated over full history gives stability.
Feature 3: Decayed Recency (The Game-Changer)
Instead of a simple average of the last 3 World Cups, I used exponential decay:
Then I computed a weighted average of goals, win rate, etc. across all tournaments. This replaced both "all-time" and "recent" stats with one principled signal.
After applying the decay, my score shot up. I went from negative to 0.854 on the public leaderboard and climbed to position 44 out of 781 competitors.
The Predictions: Reasonable and Optimistic
Here's an excerpt from my predictions. Some are reasonable, others were my model's way of saying "maybe this year":
Spain and Sweden as champions? That's optimistic. But that's what the model learned from the weighted historical data.
Attempts That Didn't Pan Out
- Limit to last 6 World Cups – This boosted strong teams but reduced contrast between them.
- Cascaded model – Classification first, then regression on the same results. No improvement.
The real issues were noisy data (non-World Cup years mixed in) and insufficient training categories for later tournament stages. I suspect the true challenge was filtering that noise and engineering better features – but I ran out of time.
Key insight: All my optimizations improved the classification problem (stage prediction) while simultaneously making the regression problem (goal scoring) worse. It was a frustrating trade-off that I couldn't quite resolve.
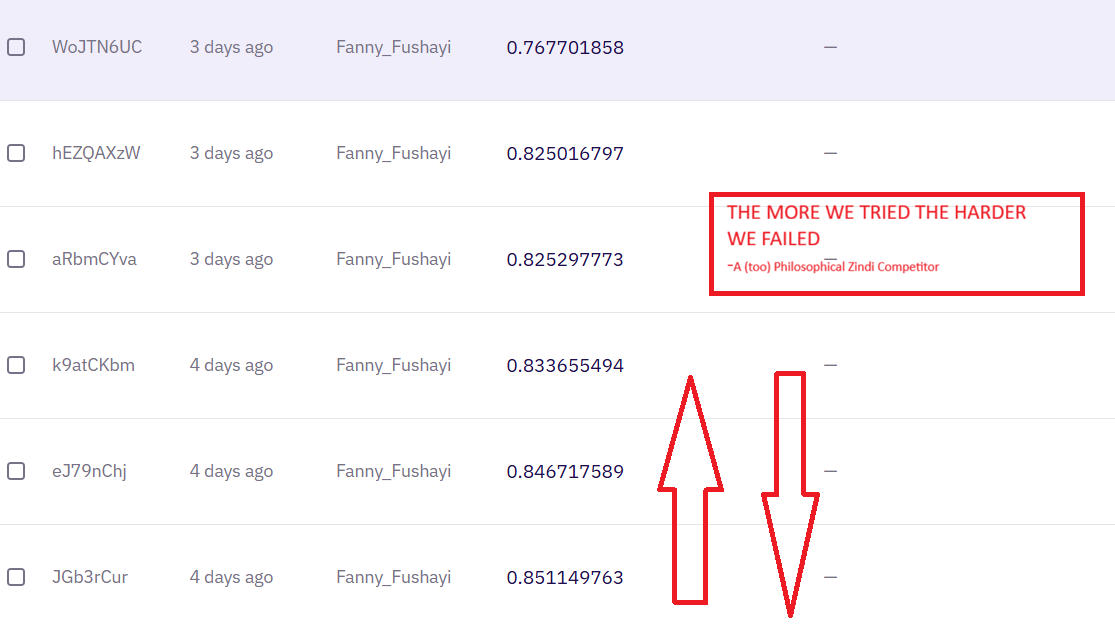
More feature engineering led to interesting trade-offs between objectives
Final Scores and Lessons

Final position: #56 on the leaderboard
Side note: I suspect there are time travelers amongst us. How am I being rated and ranked for a competition based on an event that hasn't actually happened yet? Either Zindi is from the future, or someone's gaming the system with advance knowledge. Suspicious.
What I'd Do Differently
- Start with a baseline and actually track it against later attempts.
- Inspect your data – head(), info(), and value_counts() are your best friends.
- Fix mappings early – stage names, team IDs, everything. Don't let them compound.
- Weight recency – exponential decay is powerful for sports predictions.
- Know your limits – predicting exact goals is harder than predicting knockout stages. Focus on what your data can actually support.
I went from complete bewilderment to a respectable position on the leaderboard. The key was understanding that domain knowledge matters – even without knowing soccer, historical context plus recent performance plus smart features can get you surprisingly far. Sometimes you don't need to be a hero. Just above zero is enough.
Acknowledgments: Special thanks to Tawanda Mabvira for the invaluable discussions on feature engineering approaches and for helping decode football terminology and competition dynamics that were outside my domain knowledge.