Project Overview
This exploratory data analysis (EDA) project focuses on analyzing (over 100 000) 911 emergency calls from a comprehensive dataset, from Kaggle. The primary objective was to apply data analysis and visualization methods to a real-world data set, with the secondary objective being to identify patterns, trends, and insights that could potentially help emergency services allocate resources more efficiently.
Through this analysis, I explored:
- Common locations where emergency calls originate
- Primary reasons for emergency calls
- Temporal patterns showing when emergencies are most frequent
- Geographical distributions of different emergency types
Understanding these patterns can provide valuable insights for emergency response planning and resource allocation strategies.
Dataset Description
The analysis uses a dataset containing records of 911 emergency calls, with the following key features:
Geographic Information
Latitude and longitude coordinates of each call, along with zip codes and township names to analyze spatial patterns.
Emergency Details
Descriptions and categorizations of emergency types (medical, fire, traffic, etc.) to understand the distribution of emergency reasons.
Temporal Data
Timestamps of when calls were received, allowing for time-based analysis of emergency occurrence patterns.
                    # Loading the dataset
                    import pandas as pd
                    df = pd.read_csv('911.csv')

                    # Initial exploration
                    df.head()
                    df.info()
Methodology
The analysis followed a structured approach to extract meaningful insights from the 911 calls dataset:
Step 1: Understanding the Data
Initial exploration to identify the structure, missing values, and key features available in the dataset. Grouped calls by location to find emergency hotspots.
Step 2: Feature Extraction
Created new features like 'reason' by extracting the first word from emergency titles. This simplified categorization for analysis.
Step 3: Time-Based Analysis
Converted timestamps to datetime objects and extracted month and day information to analyze temporal patterns in emergency calls.
Step 4: Visualization
Used Seaborn, Matplotlib, and Plotly to create informative visualizations that revealed patterns and trends in the data.
                    # Example of time-based feature extraction
                    df['timeStamp'] = pd.to_datetime(df['timeStamp'])
                    df['month'] = df['timeStamp'].dt.month
                    df['dayOfWeek'] = df['timeStamp'].dt.dayofweek

                    # Extracting emergency reason from title
                    df['reason'] = df['title'].apply(lambda title: title.split(':')[0])
Key Visualizations
Emergency Call Distribution by Type
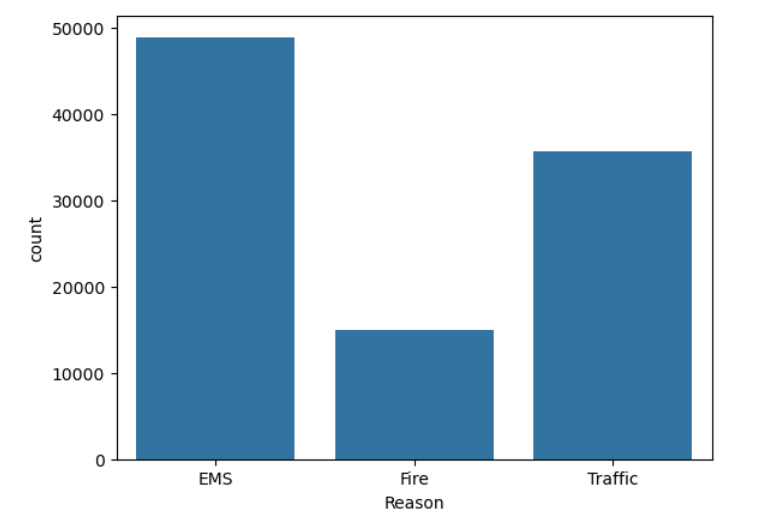
Analysis showed that medical emergencies (EMS) were the most common reason for 911 calls, followed by traffic incidents and fire-related emergencies.
Calls by day by the hour
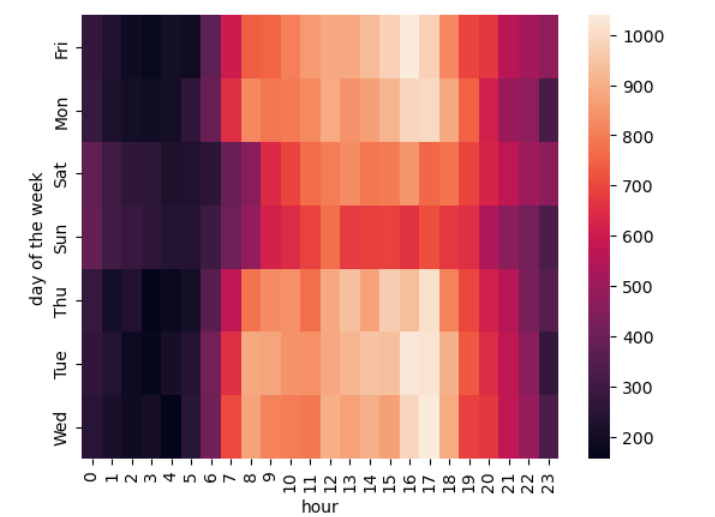
At certain hours of the day depending on the day the calls either increase or decrease
Monthly Call Trends
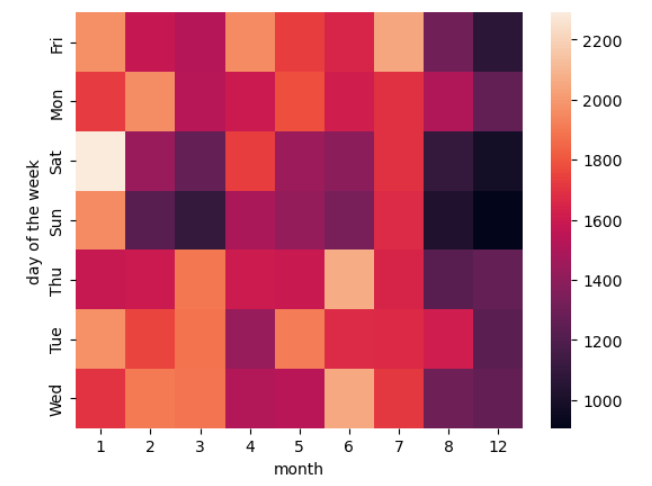
The data revealed seasonal patterns in emergency calls, with notable increases during specific months of the year.
Call Distribution by Day of Week
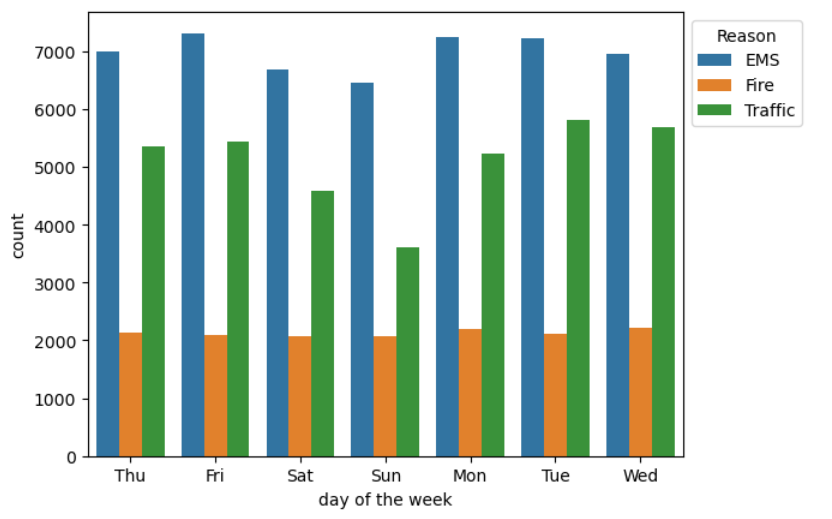
Emergency calls were not evenly distributed throughout the week, with higher volumes on certain days that could correlate with traffic patterns or work schedules.
Key Findings (These are not applied to any 'real world solution')
Emergency Type Distribution
Medical emergencies (EMS) represented the largest category of 911 calls, highlighting the critical importance of medical response readiness.
Geographical Insights
Certain zip codes and townships generated significantly more calls than others, suggesting targeted resource allocation could improve response efficiency.
Seasonal Patterns
Emergency calls showed clear seasonal trends, with certain types of emergencies increasing during specific times of the year.
Weekly Variations
Call volumes varied by day of the week, with patterns that could help in scheduling and resource planning for emergency services.
Traffic Patterns
Traffic-related calls increased during rush hours, suggesting a connection between traffic accidents and commuting patterns.
Conclusions
This analysis of 911 emergency calls has revealed valuable insights that could potentially improve emergency response systems:
- Emergency response teams should be prepared for higher volumes of medical emergencies compared to other types.
- Resource allocation could be optimized by focusing on high-call-volume locations identified in the analysis.
- Seasonal staffing adjustments might improve response times during peak emergency periods.
- Day-of-week planning could help ensure appropriate coverage when certain emergency types are more likely to occur.
Future work could extend this analysis by:
- Implementing predictive models to forecast emergency service demand
- Incorporating additional data sources like weather patterns or traffic conditions
- Developing interactive dashboards for real-time monitoring of emergency patterns
- Conducting more granular time-based analysis (hourly patterns, holiday effects)
Technical Skills Demonstrated
Data Manipulation
Used Pandas for data cleaning, transformation, and feature extraction from the raw dataset.
Statistical Analysis
Applied statistical methods to understand distributions and identify significant patterns in emergency call data.
Data Visualization
Created informative visualizations using Matplotlib, Seaborn, and Plotly to communicate findings effectively.
Time Series Analysis
Analyzed temporal patterns in emergency calls to identify daily, weekly, and seasonal trends.